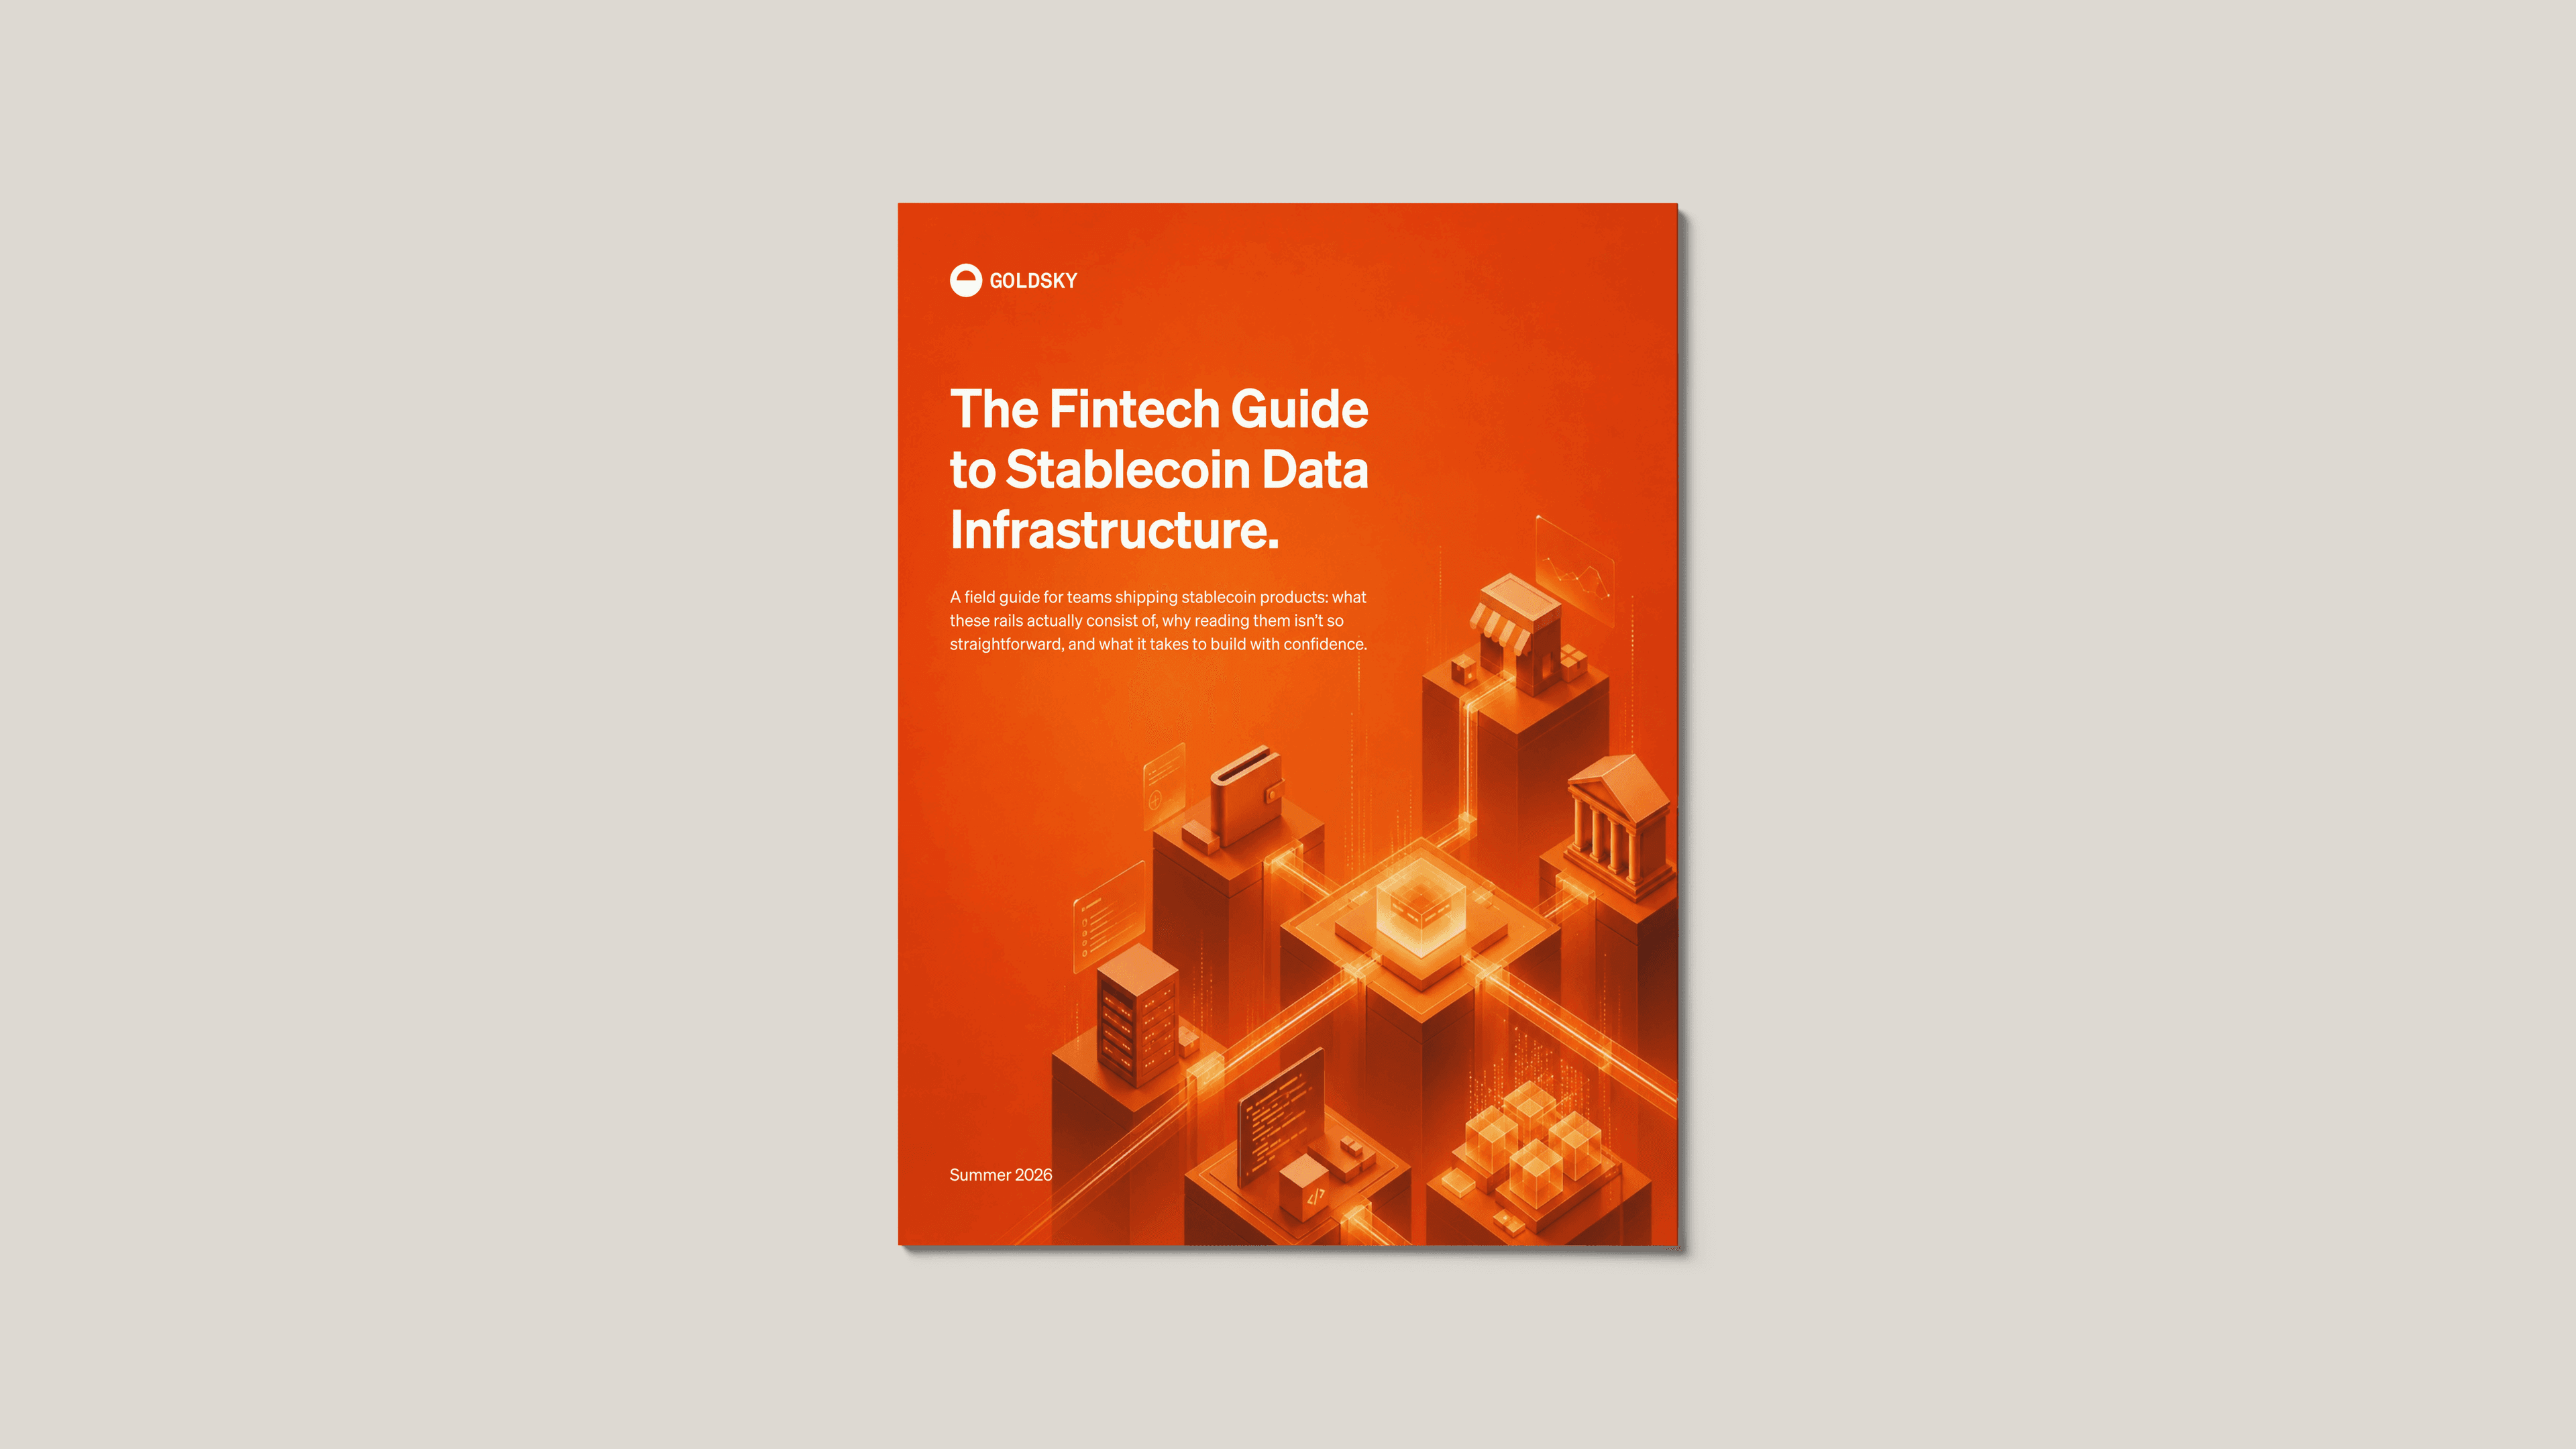
The Fintech Guide to Stablecoin Data Infrastructure
Stablecoins became payment rails. This report covers the data infrastructure they run on, with original analysis measured directly from eight chains.
· Free PDF
Last updated
What's inside
The market in payments terms: circulating supply, adjusted transfer volume, and which incumbents are already shipping
Original on-chain analysis across eight rails: Ethereum, Base, Arbitrum, Optimism, Polygon, BNB Chain, Tron, and Solana
What it takes to read chain data reliably: address poisoning, dust, reorgs, finality, and reconciliation
Build vs. buy: the engineering time, headcount, and maintenance burden behind each path
$315B
stablecoin supply outstanding, June 2026
$6.7B
in transfers reorged out of Ethereum in 90 days
90x
gap between the naive and the real median transfer
82–99%
of transfers under $3,000 on every rail
What the chain records show
A preview of the measurements inside. Every figure is read directly from the chains, not from a tracker or a dashboard.
01
The headline number is two orders of magnitude off
Stablecoins moved $33–35 trillion on-chain in 2025. Strip out arbitrage, market-making, and protocol churn and genuine payment activity is roughly $390 billion. Telling them apart takes infrastructure, not a dashboard.
02
Settled isn’t settled
In a 90-day window, 86,644 USDC and USDT transfers carrying about $6.7 billion landed in Ethereum blocks that were later reorganized away. A ledger that books inclusion as settlement credited money the chain then erased.
03
Raw chain data isn’t payment data
A naive query puts the median Ethereum stablecoin transfer at $2.59. Clean the data and it is $227. Address-poisoning spam accounts for at least 1 in 6 transfers, across 100,137 clusters of manufactured look-alike addresses.
04
Anatomy of a misleading number
$692 billion of USDC appears to move on Optimism in 90 days. Three-quarters of it is one DEX pool and four bridge relayers. Getting from the headline to the real figure takes a maintained entity graph.
05
One model doesn’t fit every chain
Poisoning runs from 39% of transfers on Ethereum to 0.1% on Tron. Tron renders addresses differently, Stellar has several ways to hold the same balance, and Solana has no per-token transfer event at all.
06
Regulation is now a data requirement
The GENIUS Act, MiCA, and the Travel Rule each attach obligations to transaction-level data. With 82–99% of transfers under $3,000, the EU’s zero floor means capturing every one of them.
Inside the report
9 chapters, from the primer to the measurements.
- 01Executive summary
- 02Stablecoins are no longer a niche asset
- 03Stablecoins are real payment rails now
- 04Adoption is no longer speculative
- 05Why adopt, and the real-world use cases at scale
- 06Stablecoin rails 101: where chain data comes from
- 07The hard part nobody sees: reading chain data reliably
- 08What are the tradeoffs of building vs. buying?
- 09A closing note on regulatory tailwinds
Who should read this
Written for product, engineering, and innovation leaders at fintechs, banks, and payment platforms.
Payments and fintech product teams
Sizing the real payment opportunity, and what “instant settlement” means once finality and reorgs are accounted for.
Banks and neobanks
What Visa, Stripe, Mastercard, and Citi have already shipped, and the three questions every stablecoin product has to answer continuously.
Engineering and data leads
Reorgs, dust, entity graphs, and per-chain quirks, plus the build vs. buy numbers: 6–12 months and $350k+ a year in-house against under a week managed.
Compliance and risk
Five obligations that each require transaction-level chain data, and how Travel Rule thresholds map onto real transfer sizes.
All figures come from Goldsky-powered infrastructure: EVM chains and Tron through our community dataset, Solana through CryptoHouse. The window is 90 days ending June 11, 2026. Counts are exact, dollar figures are gross transfer-event value, and every figure is a lower bound.
Get the full report
The PDF is free. A short form is the only gate, and the ideas above are all in it, with the charts and the method behind each number.
Frequently asked questions
How much stablecoin activity is genuine payment volume?
Can a stablecoin transfer be reversed after it settles?
Why does the median stablecoin transfer look so much smaller than it really is?
Does address-poisoning spam affect every chain equally?
What do regulations like the Travel Rule require of stablecoin data infrastructure?

 Robinhood
 HyperEVM
 Arc
Arc Solana
 Ethereum
 Polymarket
 Base
Base Tempo
Tempo Bitcoin